制作图表 柱状图等
官网:https://www.chartjs.org/docs/latest/charts/line.html
参考:https://blog.csdn.net/weixin_42577411/article/details/115695505
引入(application.html.erb)
<link rel="stylesheet" href="https://cdn.jsdelivr.net/npm/chart.js@2.9.1/dist/Chart.min.css">
<script src="https://cdn.jsdelivr.net/npm/chart.js@2.9.1/dist/Chart.min.js"></script>
创建页面
<canvas id="myChart" width="960" height="200"></canvas>
增加代码
<script>
var ctx = document.getElementById('myChart');
var myChart = new Chart(ctx, {
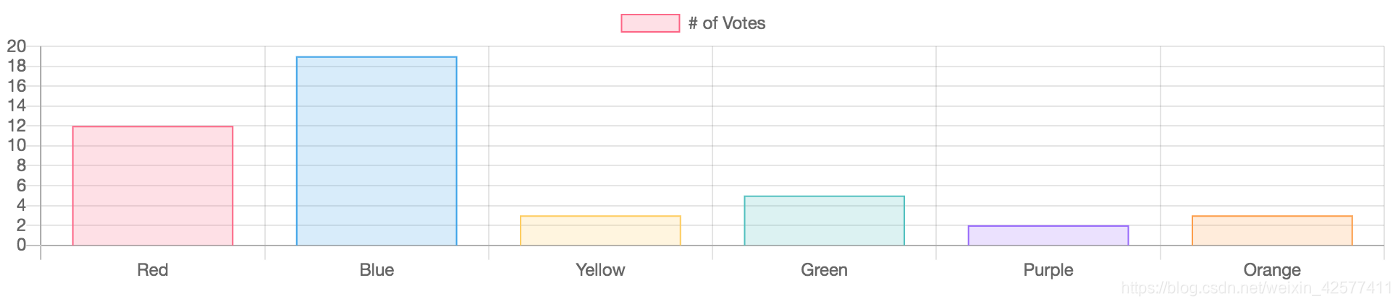
type: 'bar',
data: {
labels: ['Red', 'Blue', 'Yellow', 'Green', 'Purple', 'Orange'],
datasets: [{
label: '# of Votes',
data: [12, 19, 3, 5, 2, 3],
backgroundColor: ['rgba(255, 99, 132, 0.2)', 'rgba(54, 162, 235, 0.2)', 'rgba(255, 206, 86, 0.2)', 'rgba(75, 192, 192, 0.2)', 'rgba(153, 102, 255, 0.2)', 'rgba(255, 159, 64, 0.2)'],
borderColor: ['rgba(255, 99, 132, 1)', 'rgba(54, 162, 235, 1)', 'rgba(255, 206, 86, 1)', 'rgba(75, 192, 192, 1)', 'rgba(153, 102, 255, 1)', 'rgba(255, 159, 64, 1)'],
borderWidth: 1
}]
},
options: {
scales: {
yAxes: [{
ticks: {
beginAtZero: true
}
}]
}
}
});
</script>
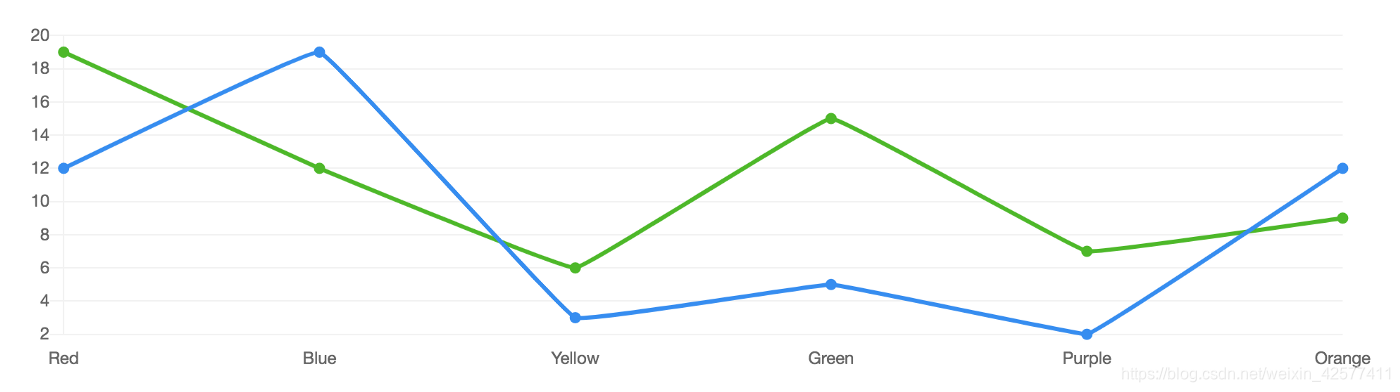
也可以换成线状的
<script>
var ctx = document.getElementById('myChart');
var myChart = new Chart(ctx, {
type: 'line',
data: {
labels: ['Red', 'Blue', 'Yellow', 'Green', 'Purple', 'Orange'],
datasets: [{
label: '# of Votes',
data: [12, 19, 3, 5, 2, 12],
fill:false,
borderColor:"#308af3",
pointBackgroundColor: "#308af3",
pointBorderWidth: 2,
pointHoverBackgroundColor: "#fff",
pointHoverBorderWidth: 2,
lineTension:0.05
}, {
label: '# of Votes',
data: [19, 12, 6, 15, 7, 9],
fill:false,
borderColor:"#48ba16",
pointBackgroundColor: "#48ba16",
pointBorderWidth: 2,
pointHoverBackgroundColor: "#fff",
pointHoverBorderWidth: 2,
lineTension:0.05
}]
},
options: {
legend: { display: false },
scales: {
xAxes: [{
gridLines: { display:false },
}],
yAxes: [{
gridLines: {
color: "rgba(0, 0, 0, .05)",
}
}]
},
}
});
</script>